Stop Debugging Like a Caveperson

I'm a software developer and computer scientist who loves building things.
During debugging, the single most important thing is knowing what value variables hold, this is what tells stories of change and points at culprits in your hair-pulling journey. In this post, I attempt to visit ways PHP developers tackle this debugging problem, hopefully we’ll learn new things and reduce the number of deaths caused by disappearing values and misbehaving operations.
Vardumpy
If we were to assign hats to different methods of peeking at what’s really going on under the hood, the var_dump() style will wear a fireman’s hat. Mostly, because users of this style are almost always quenching fires. Though we have some PHP programmers who simply don’t know better ways or hats - if you like. Nevertheless, it should be noted that this can sometimes be the fastest way to get the job done.
Calls to var_dump($suspect); is strewn across the battlefield, some users follow that up with exit() while others shamelessly type die($suspect); for reasons best known to them.
//function for adding integers
function add($first, $second)
{
    $first = (int)$first;
    $second = (int)$first;
    return $first + $second;
}

echo add(2.2, 3.0);
As at time of writing, adding declare(strict_types = 1); to the top of the file and changing the function signature to add(int $first, int $second) will be a more correct way of achieving this. But, for the sake of this demonstration let’s use this dirtier way.
Now, assuming we call this function with real values, like so add(2.2, 3.0); our result will be 5. If we didn’t know why we were getting wrong results when we pass real values, we’ll call var_dump() passing variables we suspect.
//function for adding integers
function add($first, $second)
{
    var_dump($first, $second);
    $first = (int)$first;
    $second = (int)$first;
    return $first + $second;
}
If that seems in order, we’ll move the call to var_dump() further down. We’ll keep moving them till we find the culprit - this moving of the var_dump() call - akin to setting breakpoints - could be copy-paste or cut-paste, what is important is knowing the state of the program.
//function for adding integers
function add($first, $second)
{
    $first = (int)$first;
    $second = (int)$first;
    var_dump($first, $second);
    return $first + $second;
}
Surely, you can already see the cons of this method of debugging. If you need to check any state, you must pass exactly what you want to the function, if you do change your mind about what you want to check, you’ll modify the “breakpoint” to reflect your change of mind. What if you forget to remove var_dump($DBName, $DBUser, $DBPass); or something worse?
Phpdbg
This is an interactive debugger available from PHP5.4+, it is built into PHP. It has many features, short list of those I use very frequently:
break(well, should be expected, duuh)print(printing current codes being debugged current line, method, function, current stack, class etc.)watch(setting watch points on variables)info(shows information about loaded classes, methods, functions, methods, variables, constants etc.)
Armed with this new tool let’s debug the add() function from before. We’ll begin by setting out the execution context (the code we want to debug) exec /path/to/phpfile (this is within the phpdbg console). Then we can set breakpoints, format is break <line number>. So, we are going to skip setting single breakpoints and moving them around. We’ll set as many points as we need (afterall, we aren’t making changes to our code).
prompt> break 5
[Breakpoint #0 added at /path/to/phpfile:5]
prompt> break 6
[Breakpoint #0 added at /path/to/phpfile:6]
prompt> break 7
[Breakpoint #0 added at /path/to/phpfile:7]
Next run our php file using the run command, you will notice that we’ve hit our first breakpoint as this halts the running of our code with the prompt:
[Breakpoint #0 at /path/to/phpfile:5, hits: 1]
> 00005: $first = (int)$first;
  00006: $second = (int)$second;
  00007: return $first + $second;
So, at our first breakpoint we can use the info command to see all information available, don’t be fazed by all the information there it shows all constants, classes and functions within your current scope (I hope that makes complete sense). Typing info vars shows exactly what we want at this time, details (type, name, address and value) our variables $first and $second and we can see the problem immediately - $first holds a value of 2 instead of 2.2. To do the same for the next line of code, use the step command to step to the next breakpoint.
There are so many other things this debugger can help you with, see full doc. IDE integration for phpdbg is not really up there, this sort of limits its use in large and more demanding projects. Also, phpdbg is not particularly suitable for debugging Apache or FPM processes, there is a better tool for that (xdebug). But, for command line debugging it is not only sufficient, phpdbg is also very easy to use - added incentive, no setup required, it ships with Php.
How do I use it? Usually I debug unit tests, in this case, it is very easy to use phpdbg - I even think it’s superior to XDebug when debugging from the command line.
XDebug
XDebug generally shines in Remote Host Debugging. Being quite robust and feature rich in addition to mature IDE integration (PhpStorm, Visual Studio Code, Sublime Text etc), this means it is the most used debugger for Php though it is a third party extension. So, when working from an IDE or any other text editor (with XDebug integration) setting breakpoints is a matter of clicking the gutter (just left of the line number depending on IDE/Text Editor). Note that installation for specific environments must have been completed (remote debugging has to be enabled if you intend to do web development). This installation process is beyond the scope of this post (click here for installation instructions).
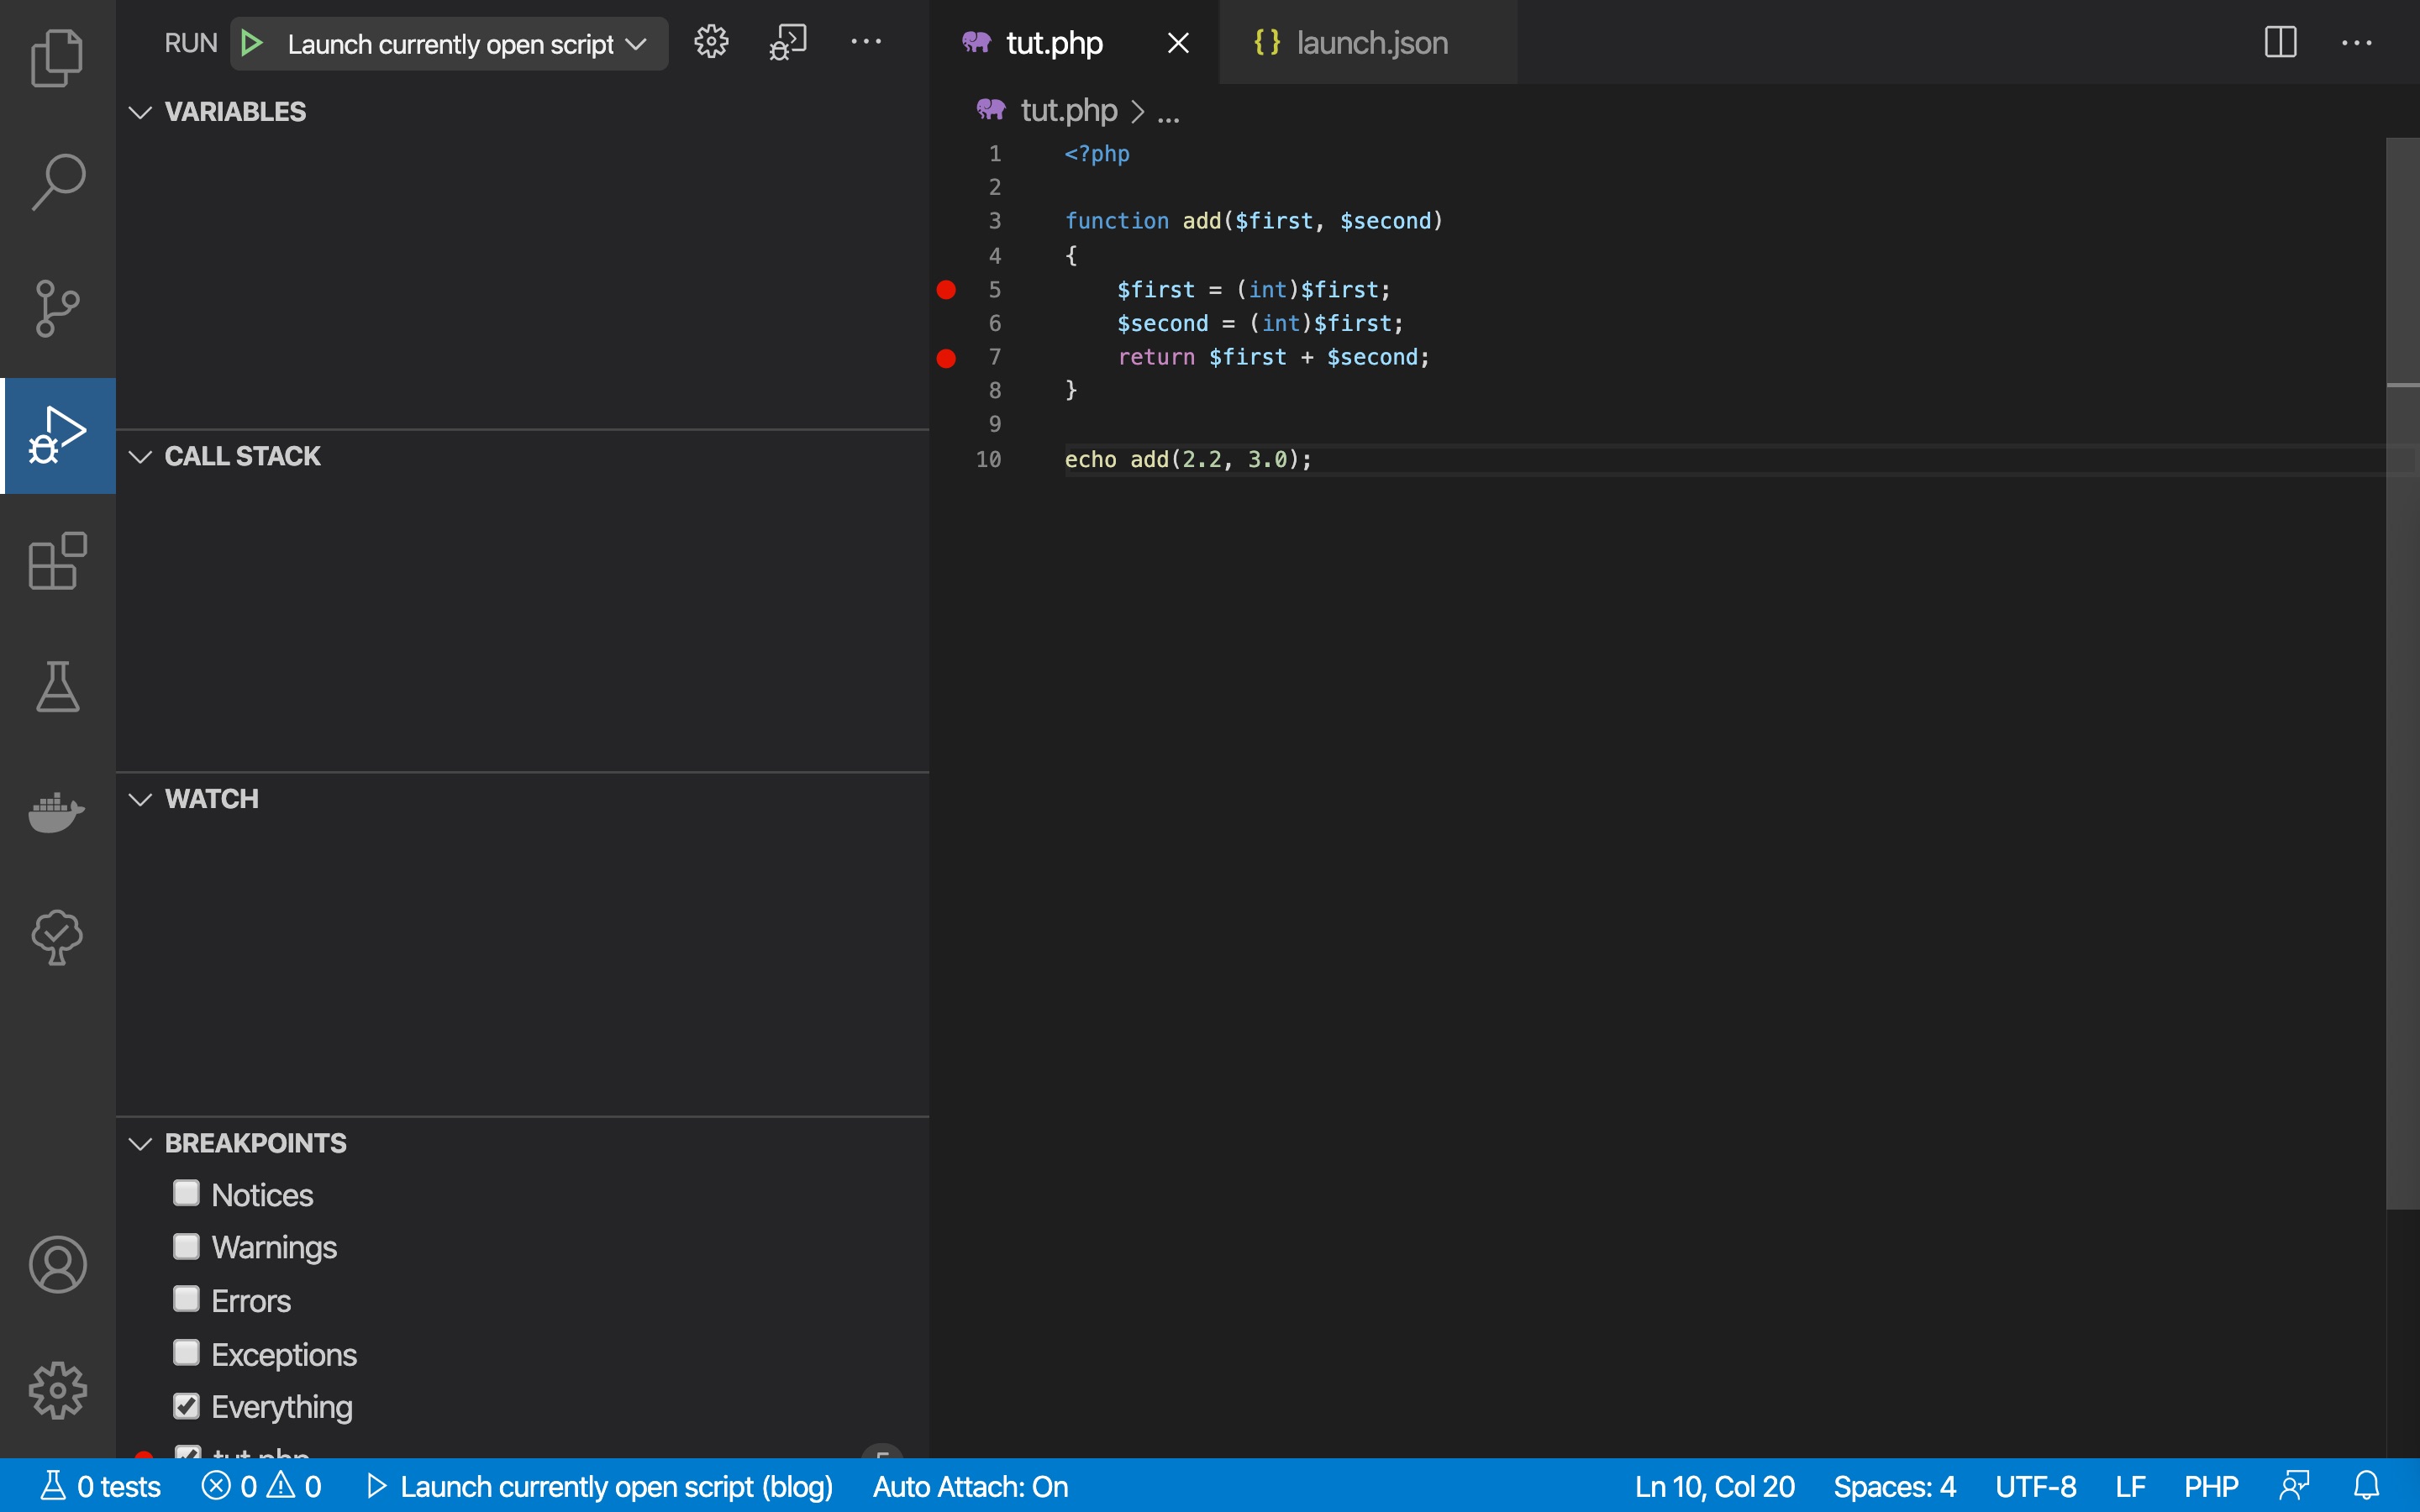
Writing and running our original code in Visual Studio Code (after installation and complete configuration) is a simple matter of setting clicking the gutters beside lines 5, 6 and 7.

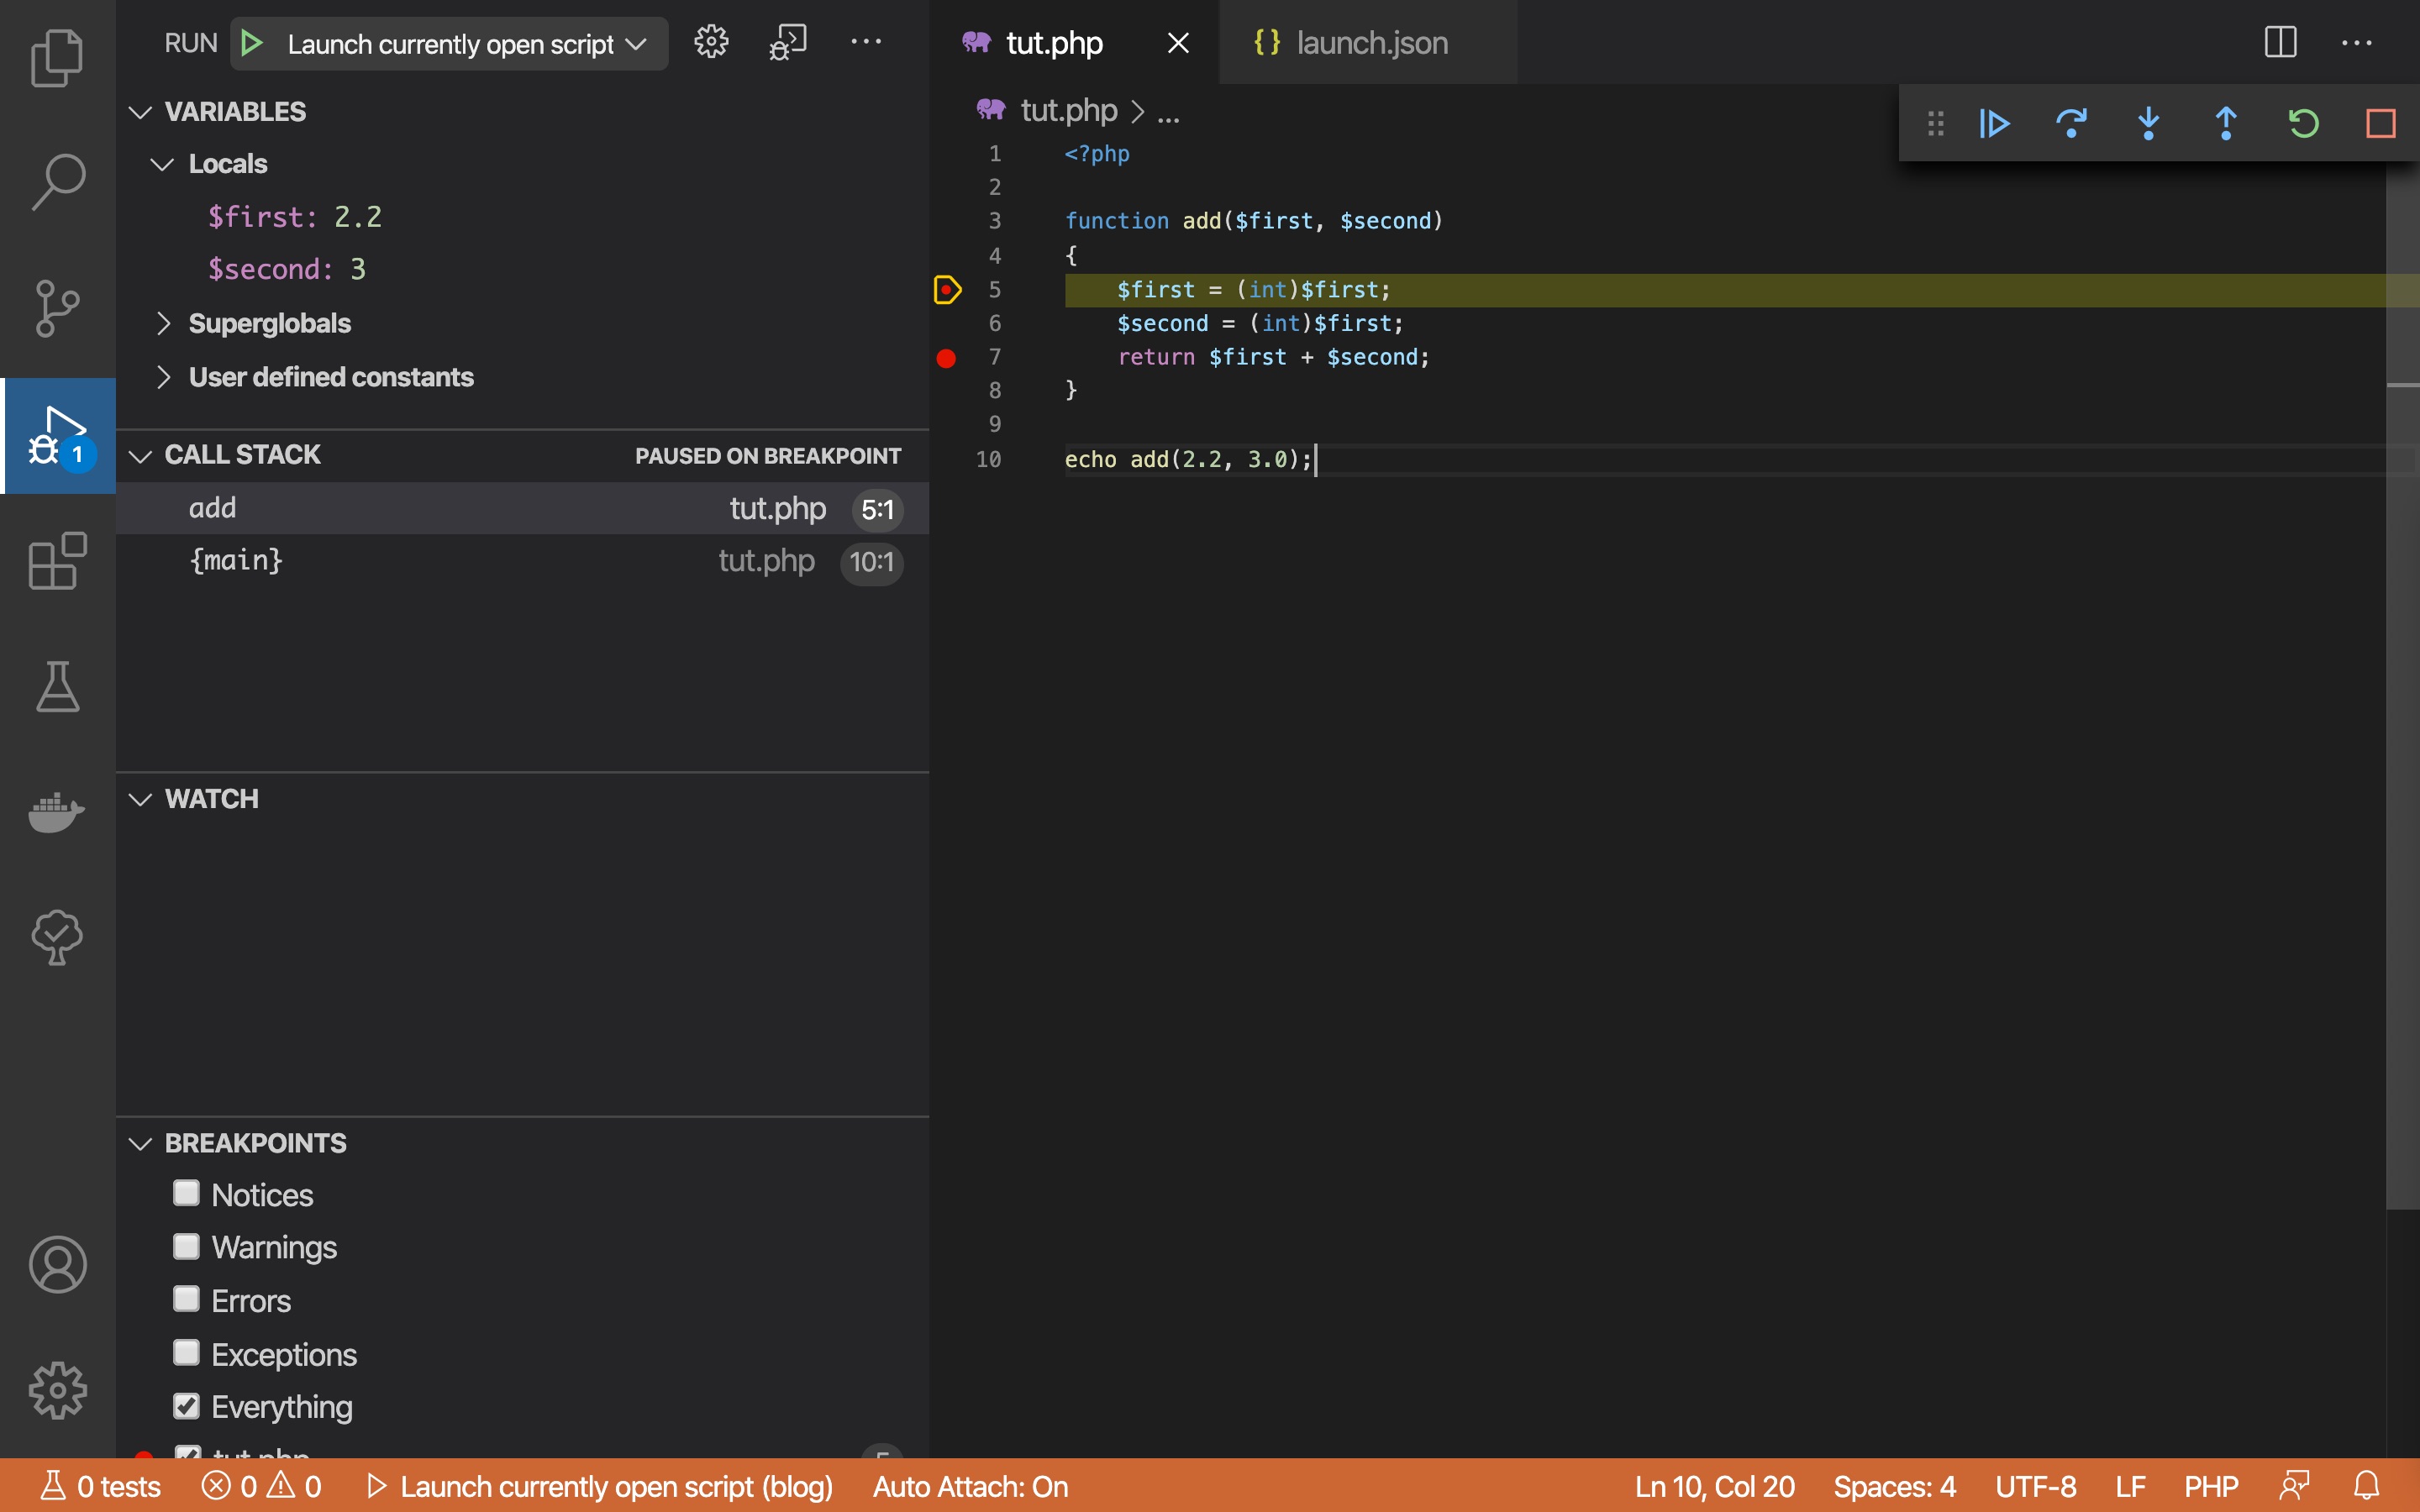
Now, running your script while Visual Studio code is listening for XDebug will cause VS Code to break into your source code at the breakpoints. Information about variables, call stack and so on can be found on the left pane, see screenshot.

Conclusion
Use what works best for you, just pick carefully what works for your use case. Also note that phpdbg ships with Php, XDebug doesn’t (Don’t debug on a production server - read don’t install XDebug on your production server)


