What is eating your Memory?
A journey to find memory leaks can lead to unexpected performance gains.

I'm a software developer and computer scientist who loves building things.
What is a memory leak?
To know what a memory is, we first need to understand what memory is in the context of computer systems. Memory refers to the storage space that a computer uses to hold data being used or processed, memory also holds instructions that are currently being executed. It is a critical resource for the performance of applications and systems. In the past, memory was very scarce resource, and developers had to be very careful about how they used it. However, with the advent of modern computing, memory has become more abundant, but it is still a finite resource that needs to be managed properly. In non-garbage collected programming languages (like C), it is the responsibility of the developer to manage memory allocation and deallocation. If a developer forgets to free up memory that is no longer needed, the program can keep consuming more and more memory over time, leading to a memory leak.
However, in garbage collected programming languages (like Go), the runtime automatically manages memory allocation and deallocation. The garbage collector identifies and frees up memory that is no longer being used by the program. In a sense, memory leeks in garbage collected languages isn't typically caused by "forgetting to free" memory. Instead, it is unintentional memory retention.
Common causes of memory leaks in Go
Goroutines
Goroutines are very cheap, but they are not free. Each goroutine starts with a small stack (typically 2KB), which can grow and shrink as needed. If a goroutine blocks forever and cannot exit, it leaks. Any variables referenced inside that goroutine also leak. Imagine a blocked goroutine that holds a reference to a large data structure. As long as that goroutine is alive, the data structure cannot be garbage collected, leading to increased memory usage over time:
func main() {
	ch := make(chan struct{})

	// data is a slice that can grow dynamically
	data := []int{}
	processData(&data)

	go func() {
		// This goroutine will block forever, leaking memory
		<-ch
		// Because we reference 'data' here, the closure captures it.
		// The Garbage Collector sees that this goroutine is still alive
		// and might eventually execute this, so it can NEVER clean up 'data'.
		fmt.Println(data)
	}()

	// The program will exit
	// but the goroutine is still blocked and leaking memory
}

func processData(data *[]int) {
	for i := range 1000000 {
		*data = append(*data, i)
	}
}
In this example, the goroutine is blocked on the channel ch, and it holds a reference to the data slice. Since the goroutine cannot exit, the data slice cannot be garbage collected, leading to a memory leak.
Sub-Slice leaks
In Go, slices usually have backing arrays. When you create a sub-slice from an existing slice, the new sub-slice still references the original backing array. If you read a massive file into memory and return a tiny slice of it, the entire massive backing array stays in memory until that tiny slice is garbage collected.
var cache []byte

func main() {
    largeFile := make([]byte, 1000000) // 1MB array
    // ... read file ...

    // The 1MB backing array is kept alive by this 5-byte slice
    cache = largeFile[:5]
}
Finding and fixing leaks
Fortunately, Go already has the tools you need to hunt and kill these pesky memory leaks, enter pprof. We will modify our code to use this new tool in our arsenal to find where the memory leak is (we are using the Goroutine we studied previously):
func main() {
	ch := make(chan struct{})

	data := []int{}
	processData(&data)

	go func() {
		<-ch
		fmt.Println(data)
	}()

	writeHeapProfile("heap.prof")
}

func writeHeapProfile(path string) {
	file, err := os.Create(path)
	if err != nil {
		log.Fatalf("create heap profile: %v", err)
	}
	defer file.Close()

    // run garbage collector so we are profiling data
	// that will not be cleaned up by our program
	runtime.GC()
	if err := pprof.WriteHeapProfile(file); err != nil {
		log.Fatalf("write heap profile: %v", err)
	}

	log.Printf("Heap profile written to %s", path)
}

func processData(data *[]int) {
	for i := range 1000000 {
		*data = append(*data, i)
	}
}
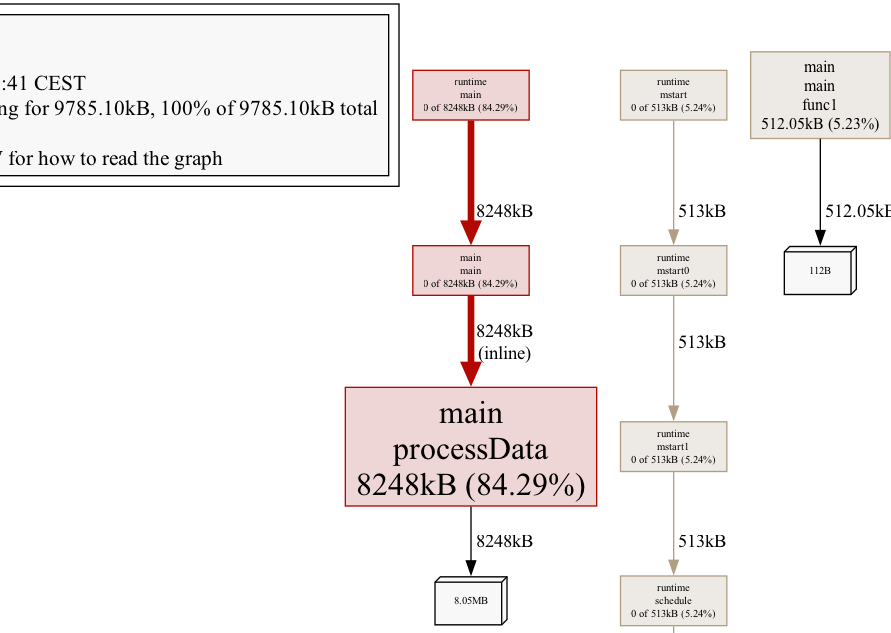
With this update to our code, we can draw a map of how data flows in our app. Following this map, we can see all data allocations and see what data we still have on the heap after our app is exited (note where we put writeHeapProfile, just before exit). Running our app will save the profile of our app in a file named heap.prof, to make it easy to visualise what is going on within our app, we use the tool thus:
go tool pprof -png heap.prof > heap.png
generating an image (cropped to highlight the relevant part):
Decoding the image
Each box represents a function that allocated memory. The visual cues we are looking for are:
Large boxes: The physical size of the box scales with the size of the allocation. A massive box means a lot of memory was allocated starting from that point in the call stack (see
processData).Red colours: As a box's allocation size grows relative to the total heap size, pprof colors it red. When hunting a leak, follow the thickest, reddest path down the graph.
Arrow thickness: The thicker the arrow, the more memory was allocated along that specific path.
Numbers on the Arrows: This indicates exactly how much of the caller's cumulative memory was contributed by that specific call path.
Looking at the image, we can see that main is holding all of the data generated in processData and we know that this is still on the stack because we triggered runtime.GC() before profiling. The leak in our program is very trivial, we can easily solve it by closing the channel to unblock the waiting goroutine (close(ch))
Follow up
Our program is very trivial and a single profile dump at the end of our program was enough to diagnose the issue. But usually, we need to see the profile over a given time frame. One easy way I found, is to add a small server we can call to get the profile dump (another easy option will be to use `runtime/pprof` package like we did but take snapshot periodically).
func main() {
	go func() {
		fmt.Println("Starting pprof server on http://localhost:6060")
		if err := http.ListenAndServe("localhost:6060", nil); err != nil {
			fmt.Println("pprof server error:", err)
		}
	}()
	ch := make(chan struct{})
	data := []int{}
	processData(&data)

	go func() {
		<-ch
		fmt.Println(data)
	}()

	time.Sleep(5 * time.Minute) // keep the program long enough to observe memory usage and pprof data
}

func processData(data *[]int) {
	for i := range 1000000 {
		*data = append(*data, i)
	}
}
While the program is running we can get the profile by executing go tool pprof http://localhost:6060/debug/pprof/heap. We can do this multiple times to fetch heap profile and see the growth. For real servers or very long running apps we can use the diff tool like go tool pprof -http=:8080 -base base.prof current.prof. I won't go deep into that use-case, unless there is a request for it.
Conclusion
We've shown a simple use-case of pprof and simplified reading and understanding the profiling data. Our program was extremely simple and that is reflected in the profiling graph we got out of it - it can have a whole lot more branches. But, the fundamentals still apply, look at the largest red boxes and follow the reddest thickest arrows. Note pprof can be used for much more than finding memory leaks, you can use it to find performance bottlenecks. Reducing the size of the boxes and reducing the thickness of the arrows, will generally reduce the footprint of your program.


